Back to case studies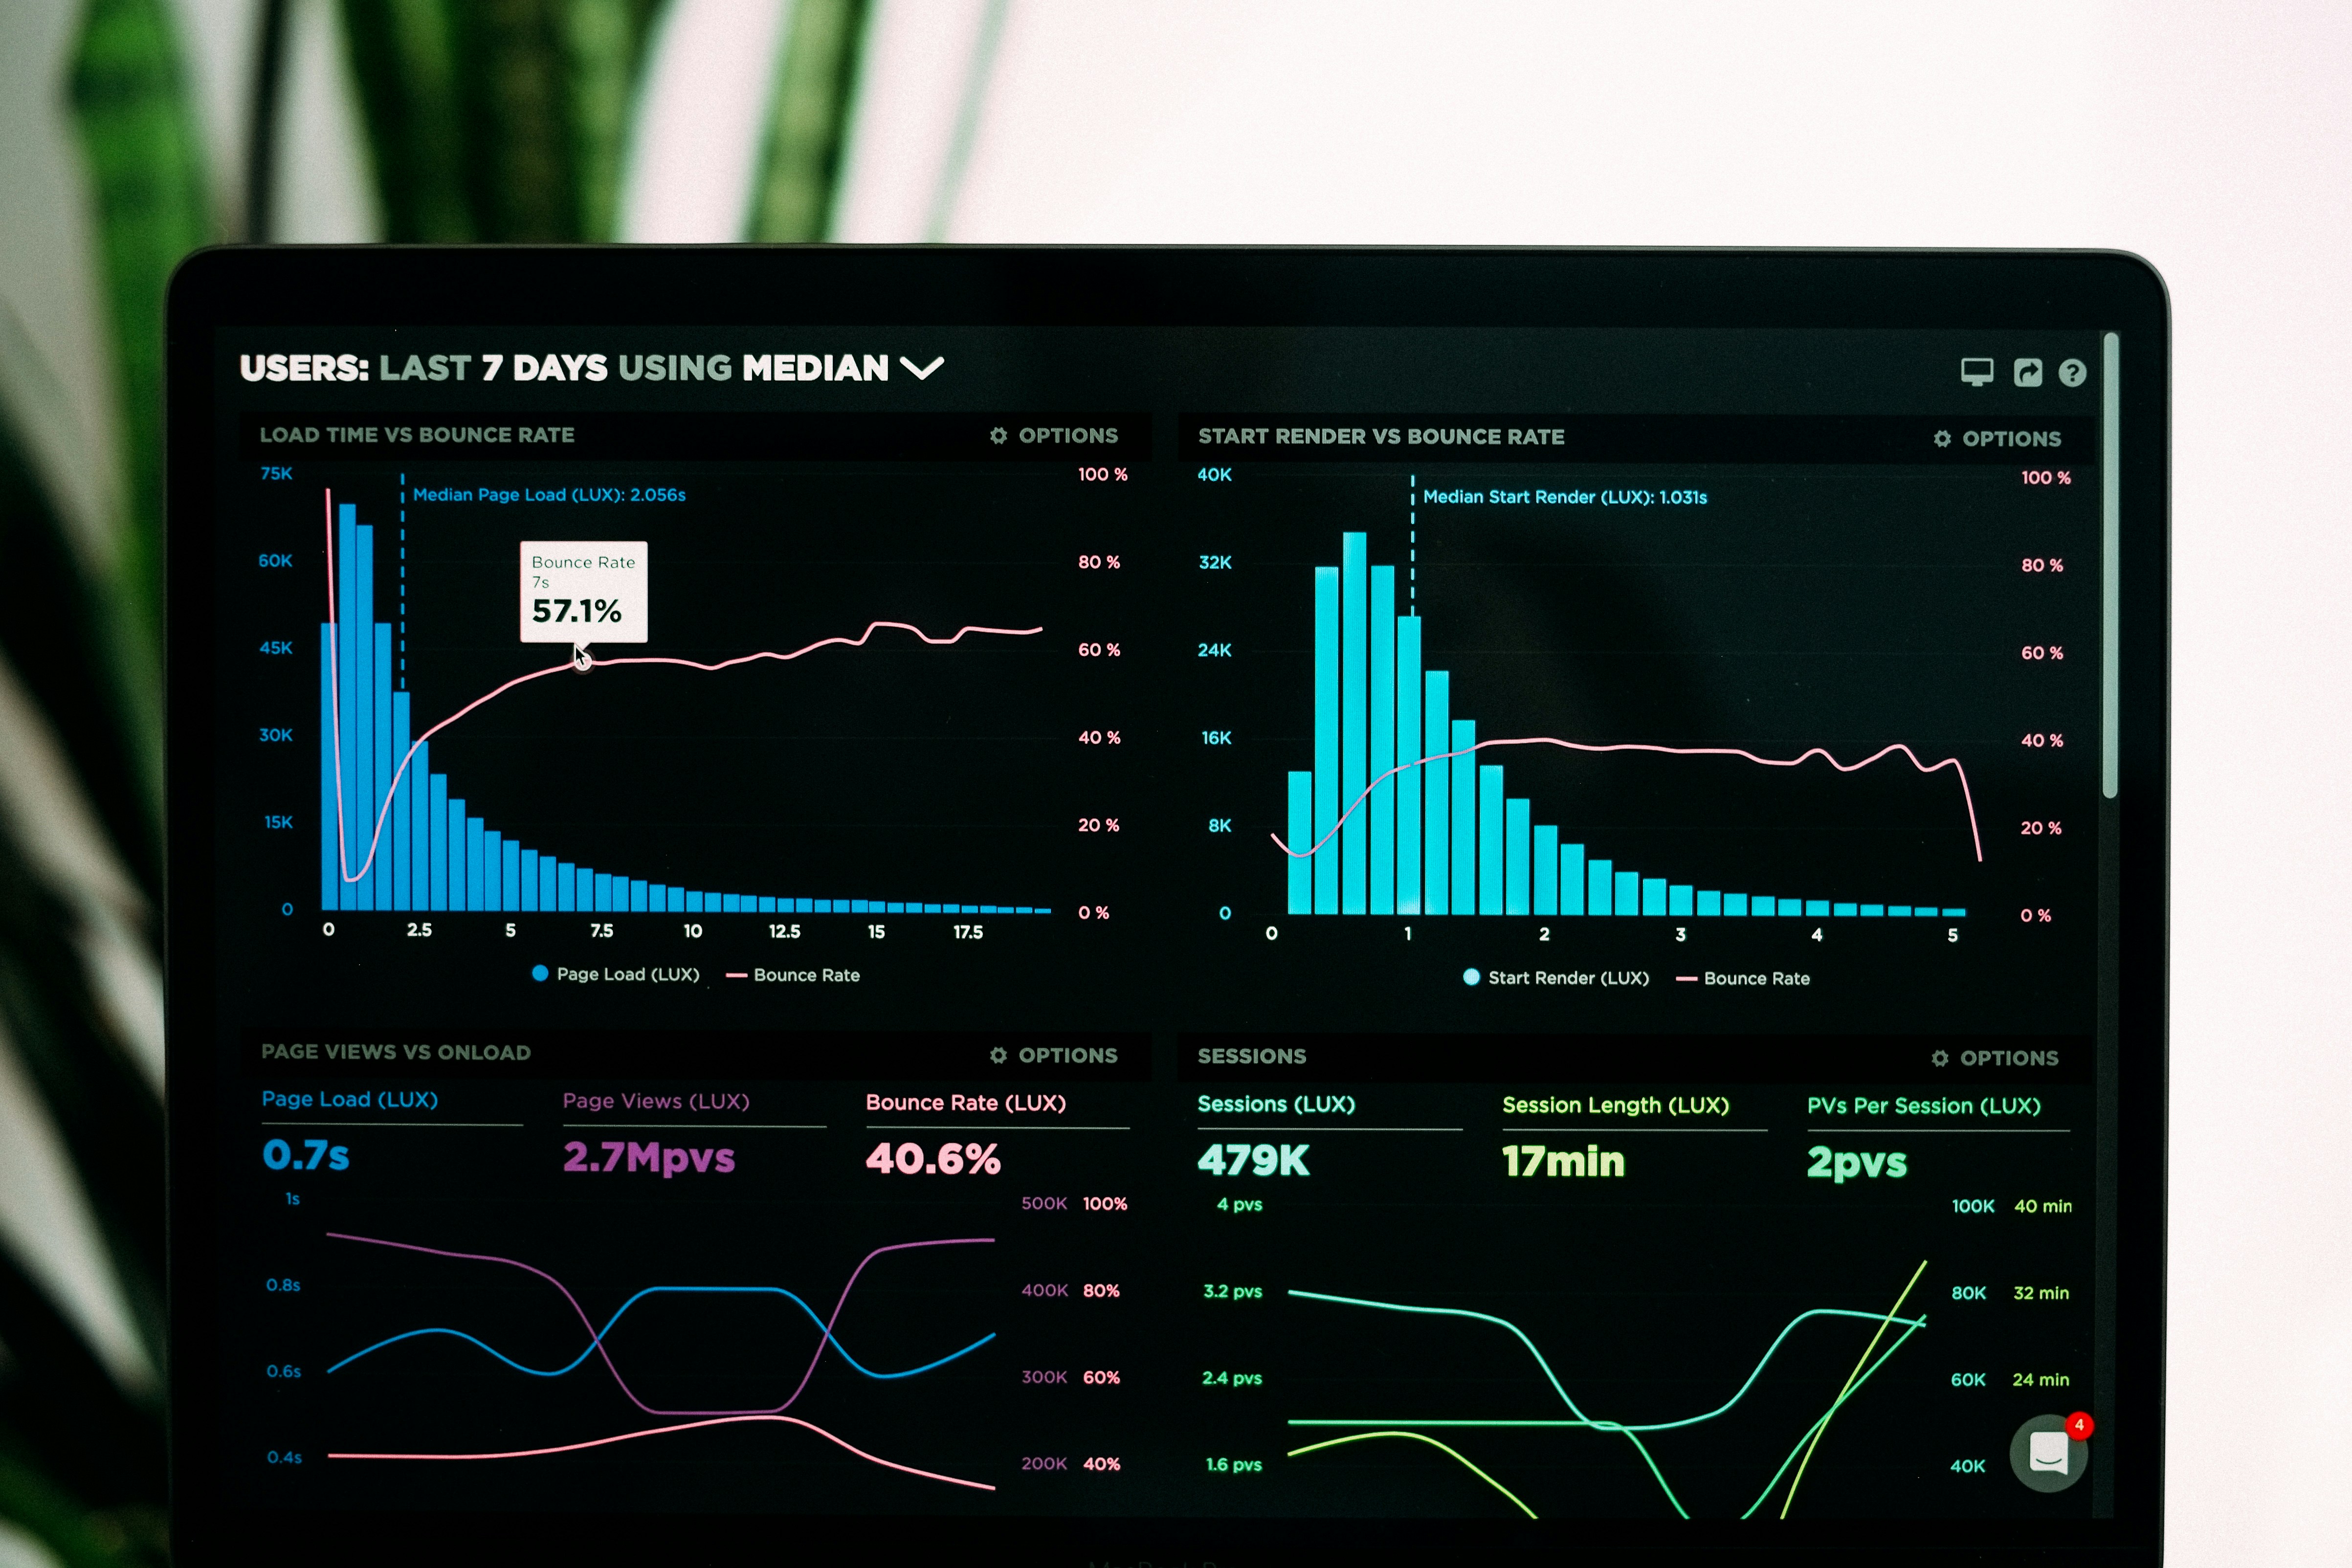
Case StudyFinanceAnalyticsBusiness Intelligence
Financial services Firm Improved Data Visibility
2 min read
Executive dashboards provided real-time insights across business operations.
Financial Services Firm Improved Data Visibility
In the fast-paced financial sector, delayed reporting and fragmented data can impede risk management, regulatory compliance, and strategic decision-making. Executive leadership requires real-time, high-level visibility across portfolio performance, operational risk, and client account activities to capitalize on market opportunities and mitigate exposure. To eliminate reporting silos, a regional financial services firm developed a centralized data analytics architecture and executive dashboard suite.
1. The Challenge: Fragmented Data and Manual Reporting Cycles
The firm faced several data aggregation hurdles that slowed operational responsiveness:
- Siloed Legacy Systems: Transaction records, risk models, and client CRM data were stored across isolated databases that could not communicate effectively.
- Delayed Executive Reporting: Compiling monthly performance and compliance reports required days of manual data extraction and spreadsheet manipulation by analysts.
- Lack of Real-Time Risk Visibility: Leadership lacked instant, consolidated views of portfolio performance and liquidity metrics, increasing exposure to market fluctuations.
2. The Solution: Unified Data Pipeline and Executive Dashboards
To establish a single source of truth, the firm built a scalable, cloud-based data pipeline and visualization interface:
- Centralized Data Warehouse Integration: Consolidated data streams from internal transaction databases, external market APIs, and CRM platforms into a secure, encrypted data warehouse.
- Automated ETL Pipelines: Implemented automated Extract, Transform, Load (ETL) workflows to clean, validate, and update operational datasets in near real time.
- Custom Role-Based Dashboards: Designed executive dashboard views tailored for C-suite leadership, compliance officers, and portfolio managers, featuring real-time KPIs, trend forecasts, and drill-down analytics.
3. The Results: Faster Decision-Making and Operational Efficiency
Within three months of deploying the unified data analytics platform, the firm achieved major operational improvements:
- 90% Reduction in Reporting Generation Time: Monthly and quarterly performance reports were generated automatically in seconds rather than days.
- Real-Time Risk Assessment: Leadership gained instant visibility into portfolio health, liquidity ratios, and market risk exposure.
- 40% Increase in Analyst Productivity: Financial analysts redirected hours previously spent on manual data entry toward strategic market analysis and asset management.
- Enhanced Regulatory Audit Readiness: Standardized data structures and automated audit trails simplified compliance verification and regulatory reporting.
Key Takeaway
For financial services institutions, data visibility directly drives operational agility. Unifying siloed databases into real-time executive dashboards eliminates reporting latency, reduces operational risk, and empowers leadership to make informed decisions with confidence.
Let's Build Something Amazing
Ready to Transform Your Business?
Stop wasting time with multiple freelancers. Get a dedicated team that handles everything from design to development to marketing.
✓
Free 30-Minute Consultation
No commitment. Just an honest conversation about your project.
✓
Detailed Project Proposal
Clear timeline, transparent pricing, and actionable roadmap.
✓
Fast Response Time
We reply within 24 hours, usually much faster.
Get Started Today
Fill out the form below